An Undersampling Wrapup
November 27, 2012

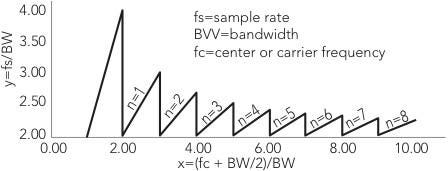
My recent column about undersampling included a table that showed upper and lower sampling frequencies for a carrier signal at 55MHz with an 8MHz bandwidth. You also can look at sample rates graphically; an example appears below. This information relates the highest-frequency component in a signal to a minimum sample rate.

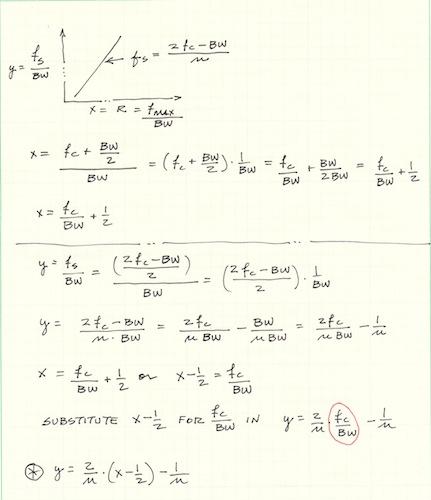
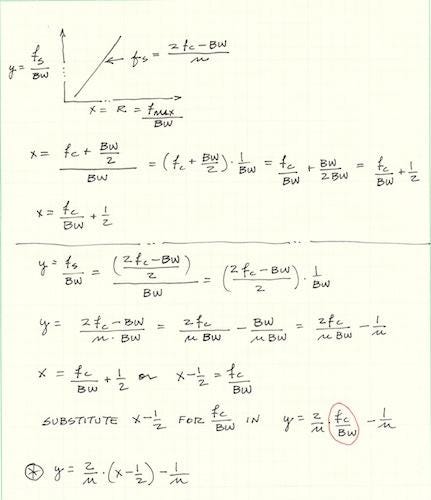
The chart shows normalized data as a ratio of frequency to bandwidth, BW. The y axis represents values of minimum sample frequency divided by bandwidth: y = (fs/BW). The x axis represents values of the highest-frequency component divided by bandwidth, or center frequency (fc), plus half the bandwidth, divided by bandwidth: x = [fc + (BW/2)]/BW.
By using the definitions of minimum sample frequency, and rearranging the equation:
fs = (2∙fc + BW)/(n + 1) or 2∙[fc + (BW/2)]/(n + 1)
Thus, y = fs/BW or 2∙[fc + (BW/2)]/[BW∙(n + 1)]
Now substitute x for the portion of the equation shown above in bold to yield: y = (2∙x)/(n + 1). Remember that x and y values represent unit-less ratios.
If you look at the graph above and use the 55MHz signal (fc) with an 8MHz bandwidth (BW), you can calculate [fc + (BW/2)]/BW and find that value on the x axis [(55 MHz + 5 MHz)/8 MHz] 7.4. From that point, go upward until you reach the line for n = 6, and then go horizontally to the y axis and find the fs/BW value. I found the y-axis value 2.11. From that ratio, calculate the minimum sampling frequency, fs. In this example, 2.11 = fs/BW, so fs = 2.11∙BW = 2.11∙8 MHz = 16.9 MHz, which comes close to the value shown in a table in the November column. That table included upper and lower sampling frequencies.
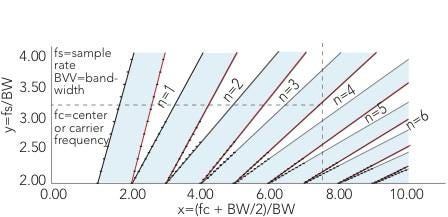
You also can graph the ratios of highest sample frequency to bandwidth against values of the highest-frequency component divided by bandwidth.

This image shows that plot with extrapolated lines. The shaded areas represent restricted zones in which you cannot choose a corresponding fs/BW value from the y axis. The vertical green line represents the [fc + (BW/2)]/BW ratio for the 55MHz signal. The green horizontal line picks off one sample point on the y axis that corresponds to 26.2 Msamples/sec.

In practice, you should stay away from restricted-area boundaries. The DSP practitioner Richard Lyons recommends using an intermediate value in the white zones between restricted zones. For anyone interested in more information, I highly recommend Rick's book.
Do you have a measurement question you'd like answered here? Contact me at [email protected].
Reference:Lyons, Richard G., "Understanding Digital Signal Processing," 2 ed., Pearson Education, Inc., 2004. ISBN: 978-0-13-108989-7.
Related posts:
About the Author(s)
You May Also Like
.jpg?width=300&auto=webp&quality=80&disable=upscale)


