Unraveling Hidden Issues With Real-Time Operating System (RTOS) Tracing
Here's why and how you should be tracing your real-time operating system (RTOS) throughout the entire development cycle.
August 30, 2023
Today, one of the most underrated capabilities in embedded software development is tracing a real-time operating system (RTOS) application. RTOSs have found their way into nearly all IoT devices and many disconnected devices. When developers test their systems, they often look at external system behaviors to gauge whether it works correctly. The problem with this approach is that many systems have behaviors that must occur deterministically on timescales of less than 50 milliseconds. Without tracing, you might believe the system is working, only to discover when it’s in your customers' hands that it is flawed and not working correctly under all circumstances. In this post, I will walk you through some trace capabilities and share examples of how I spotted issues that may not have been discovered until the devices were in the field.
Understanding Real-Time Operating System (RTOS) Tracing
Before we look at a few specific examples, it’s helpful to understand how to trace an RTOS application. Typically, there are two parts: a recorder library that tracks events in the RTOS application on the target and a visualization GUI that receives and displays the event data. Several tools allow developers to capture this data, such as Percepio Tracealyzer, SEGGER SystemView, and Microsoft Azure RTOS TraceX. There are many others, but the tool you use will depend on the RTOS you are using and your visualization needs.
You would generally install the tools trace recorder library, which often creates a trace task. This low-priority task takes the recorded event data and transmits it to the host application (at least in a streaming mode). I mention this because when you instrument your code in this way, it’s important to note that extra CPU cycles will be dedicated to recording the trace data. In my experiences using these tools, the overhead is so minimal that you don’t notice it (at least in any application I’ve worked on). It’s important to know to decide whether you will leave the trace recorder in your release firmware. If you don’t, test and validate your application with your release firmware!
Catching CPU Utilization Issues
I recently coached a team of engineers who had started validation testing on their product. They ran through their tests and believed that their system was running flawlessly. They told me their system was ready to ship; they saw a minor issue with their system's telemetry timing—no big deal. In my experience, there is no such thing as a minor issue. Minor issues are usually the tip of the iceberg that turn into titanic issues when they get into the hands of the customer. So, we set up Percepio Tracealyzer to trace the application and see how their system was flawlessly performing.
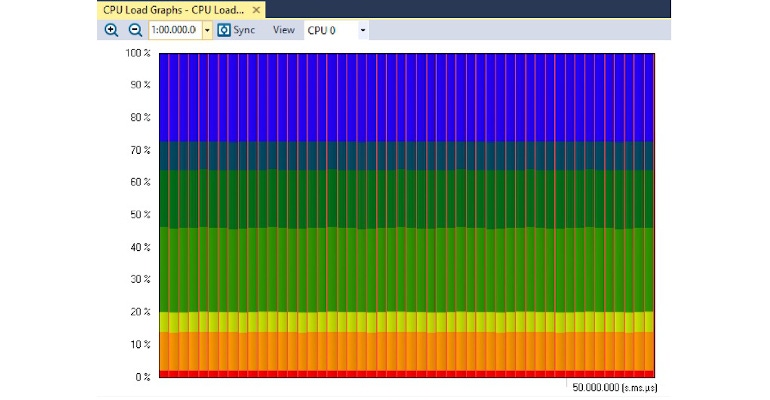
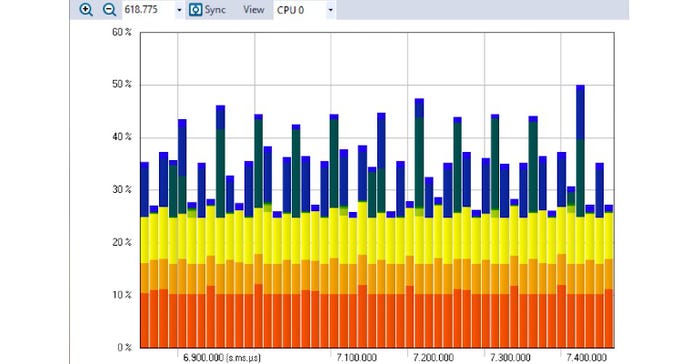
If you look at Figure 1 below, you can see a representation of the system's CPU utilization. Each color in the diagram is a different task. The x-axis is time, and the y-axis is the CPU utilization. Does this look like a validated system ready to go into the hands of customers?
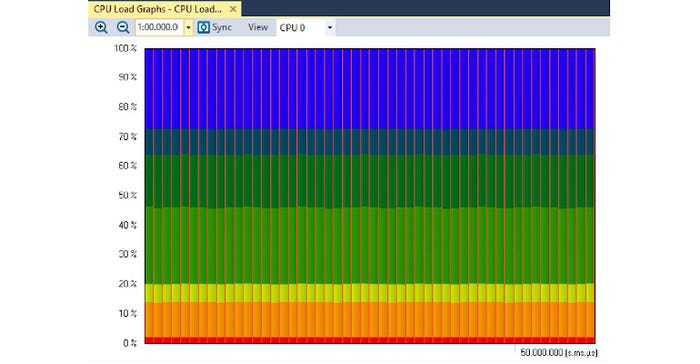
Unfortunately, the system in question was utilization 100% of the CPU. Upon closer examination, it was missing critical deadlines and not operating deterministically. Human observation was useless in discovering these issues by tracing the application. Had the product shipped like this, customers would have had problems. By taking some simple traces, we could see an issue and remedy the situation. Diving a bit deeper, we identified a few small causes that took less than half a day to fix, and the resulting CPU utilization went from Figure 1 to something like Figure 2.
The improved CPU utilization is much lower and leaves headroom for adding future features and ensuring the customer has a system that can respond and meet its deadlines.
Catching Abnormal Behavior
RTOS tracing doesn’t just catch issues with CPU performance. It acts like an oscilloscope for software! When threads are visualized, you can spot different patterns in your system and identify inconsistencies. The result is that you can find issues like priority inversions, deadlocks, and task starvation. Let’s look at an example.
After fixing the CPU utilization issue, there was a temptation to celebrate. The system looked good, right? Just because your CPU utilization looks good doesn’t mean all the threads are behaving correctly. After examining the task performance reports and traces, I noticed something interesting. One of the tasks (yellow) that was supposed to be executed periodically wasn’t. It would run three times close to correctly, make a long pause, and then resume, as shown in Figure 3.
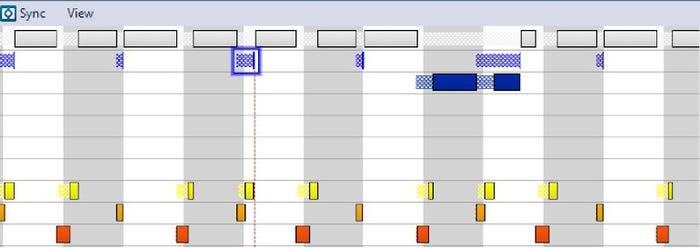
Using the trace tool, it turned out that there was a 50% variation in the periodicity of the task! Would a human notice this without tracing? No. Would it affect how this system performed and cause issues in the field? Yes! Once again, after seeing the problem, it took less than an hour to track down and resolve! However, without the trace tool, the product would have gone into the field, had issues, and resulted in angry customers and potentially long debug cycles trying to identify the root cause.
Conclusions
If you are writing an application that uses an RTOS, you should be tracing your application. You shouldn’t be tracing it right before it goes into your customers' hands but throughout your entire development cycle. If you can catch a software change that causes a problem immediately, you can fix it quickly and save time and money from trying to find it later in the development cycle. You really can’t understand what your system is doing until you trace it, and only then can you determine if it is behaving the way you think it should. I’ve been using trace tools for half a decade or more now, and I can’t tell you how many times they’ve helped me spot issues I would not have otherwise. Like unit tests, I find tracing an indispensable tool, and I think you will, too.
About the Author(s)
You May Also Like


