Frequency Response: The Gold Standard
May 8, 2013
What do engineers see when they look at a real system or conceive a new design? They will look past the hardware and visualize the flow of energy, where it is stored, and where it is dissipated. They will identify the kinetic energy of moving fluids and solid masses; the potential energy of compressible fluids, elastic hoses and tanks, and deformable solids; the energy stored in electric and magnetic fields; and the energy lost when friction generates heat. But they will also see how the system might respond to real-world inputs by understanding its frequency response and the frequency spectrum of the probable inputs.
A real system often can be modeled over some range of motion and time duration as a stable, linear, time-invariant system. If the input to this system is a sine wave, the steady-state output (after the transients have died out) is a sine wave with the same frequency, but the amplitude and phase angle are both frequency dependent. Plots of the input-output amplitude ratio versus frequency and the phase angle versus frequency are called the Bode plots. If the system being excited were a nonlinear or time-varying one, the output might contain frequencies other than the input frequency, and the amplitude ratio might be dependent on the input magnitude.
Any real-world device or process will need to function properly for only a certain range of frequencies. Outside this range, we don't care what happens. When one has the frequency response curves for any system and is given a specific sinusoidal input, it is easy to calculate the sinusoidal output. What is not obvious -- but extremely important -- is that the frequency response curves are really a complete description of the system's dynamic behavior. They allow us to compute the response for any input, not just sine waves.
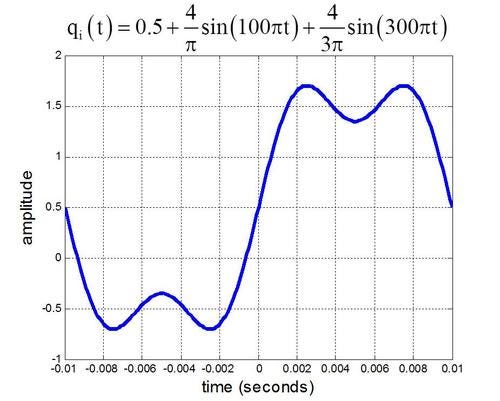
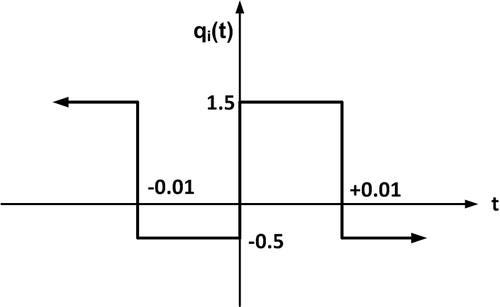
Jean Baptiste Fourier showed 200 years ago that any periodic waveform that exists in nature can be generated by adding up sine waves. By picking the amplitudes, frequencies, and phases of these sine waves, one can generate a waveform identical to the desired signal. A periodic function qi(t) can be represented by an infinite series of terms called a Fourier series. The figures show a square wave and a plot of the first few terms of the Fourier series. The more terms one uses in the series, the better the fit will be.
Using the principle of superposition for linear systems, we can combine the frequency spectrum of a real-world signal with the system's frequency response and calculate the system time response. The device used to determine a system's frequency response experimentally is a dynamic signal analyzer, and there are many excellent application notes available on its use.
Frequency response testing plays a most significant role in grey-box modeling, which we explored in a post last month. For example, once one has the model structure for a device, such as a solenoid-operated proportional valve used in fluid power applications, the measured frequency response data can be used with optimization algorithms to determine the model parameters. And we all know that a model is worth a thousand tests. This exact situation is presented by The MathWorks.
Related posts:
About the Author(s)
You May Also Like
