How to Debug a Microcontroller Using Visual Studio Code (VS Code)
Visual Studio Code gives developers flexibility with a variety of tools and customizations. Here's how to set up a VS Code configuration to debug an embedded target.
November 7, 2023

At a Glance
- Use Visual Studio Code as a highly configured editor
- Configure using Cortex-Debug
- Try SEGGER J-Link with VSC
If you’re starting to develop embedded software using Visual Studio Code (VS Code), a question at the top of your list is, “How do I debug my code?” In a vendor-supplied IDE using Eclipse, debugging was clicking a button and letting a bunch of magic happen in the background. In VS Code, if you click the debug button, you’ll likely get a complaint that there is no configuration set. In this post, we will look at how to set up a VS Code configuration to debug an embedded target.
Finding an Embedded Debug Extension
There are several different options for getting started with debugging an embedded target. You could use the built-in cppdbg option C/C++ developers use for on-host debugging. While this is an option, you’ll find that it might be challenging to set up additional features like register map viewing, RTOS-aware debugging, and so forth. For these capabilities, you need an extension designed for microcontrollers.
There are several options for extensions you can choose from to get these capabilities. For example:
Cortex-Debug: Designed for ARM Cortex-M microcontrollers, it provides a visual interface and integration with tools like J-Link, OpenOCD, and ST-Link.
PlatformIO: An open-source ecosystem for IoT development. It supports many boards and platforms and provides a unified debugger for the most popular debugging probes.
Embedded Tools: Aim to make developing embedded systems in VS Code easier by integrating several tools and utilities required for embedded development.
For today, we’ll look at how to set up Cortex-Debug.
Configuring Cortex Debug
The great thing about Cortex Debug is that it works well once you install the extension. In most cases, there is little to no configuration required. The plug-in typically can find your GCC and gdb installations on its own, so all you must do is set up a VS Code configuration.
Within VS Code, there are a couple of ways to create the configuration. First, you can use the command palette. Second, you can click the menu Run->Add Configuration. I prefer to use the second method, which we will discuss. Adding a configuration will create the launch.json file in the .vscode directory of your project workspace.
Let’s say that we want to debug an STM32L4x5 microcontroller. To do this, we might add a configuration that looks something like the following:
{
// Use IntelliSense to learn about possible attributes.
// Hover to view descriptions of existing attributes.
// For more information, visit: https://go.microsoft.com/fwlink/?linkid=830387
"version": "0.2.0",
"configurations": [
{
"cwd": "${workspaceFolder}",
"executable": "./build/bin/controller.elf",
"name": "Debug with ST-Link",
"request": "launch",
"type": "cortex-debug",
"runToEntryPoint": "main",
"showDevDebugOutput": "none",
"servertype": "stlink",
"svdFile": "${workspaceFolder}/config/STM32L4x5.svd",
},
]
}
You can see from the configuration, that there are several things we are doing:
Defining the location of our elf file (executable)
Providing a name for the debug target within VS Code (name)
Specifying that we want to use the cortex-debug extension (type)
Identifying the debug tool type, st-link (servertype)
What the memory map for the process looks like (svdFile)
With this information, launching a debug session and walking through your code on the target is possible, just like you are using a vendor-provided IDE.
Configuration using SEGGER J-Link
What if you aren’t using STLink? What if you want to use a J-Link? In this case, we would make a few changes to the configuration. These might include:
The VS Code debug name that is displayed (name)
The location of the debug application (serverpath)
The server type would now be jlink (servertype)
We’ll need to tell J-Link what device it is (device)
We’ll need to tell J-Link what the interface is, JTAG or SWD (interface)
The implementation of these changes would result in a configuration file that looks like the following:
{
// Use IntelliSense to learn about possible attributes.
// Hover to view descriptions of existing attributes.
// For more information, visit: https://go.microsoft.com/fwlink/?linkid=830387
"version": "0.2.0",
"configurations": [
{
"cwd": "${workspaceFolder}",
"executable": "./build/bin/controller.elf"",
"name": "Debug with J-Link",
"request": "launch",
"type": "cortex-debug",
"runToEntryPoint": "main",
"showDevDebugOutput": "none",
"serverpath": "/Applications/SEGGER/JLink_V770e/JLinkGDBServerCLExe",
"servertype": "jlink",
"device": " STM32L4x5",
"interface": "swd",
"runToMain": true,
"svdFile": "${workspaceFolder}/config/STM32L4x5.svd "
},
]
}
Debugging the Microcontroller
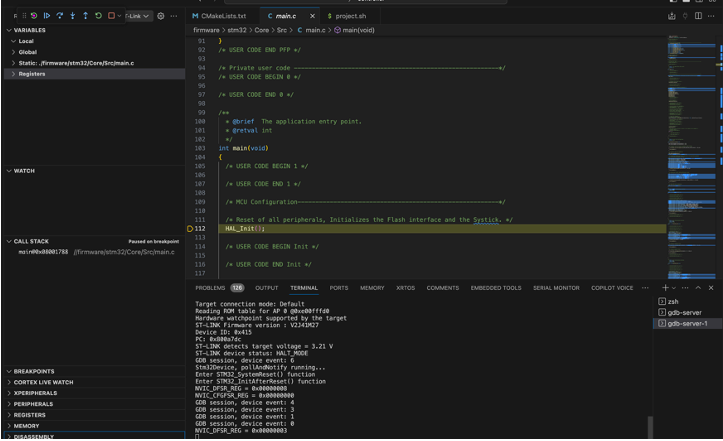
With the configuration in place, all you need to do is click on Run->Start Debugging and if everything is configured properly, you’ll see a debug terminal open up and connect to your target. You should see the familiar debug screen with a breakpoint at main as shown in the image below:

A familiar debug screen COURTESY JACOB BENINGO
Conclusions
Visual Studio Code is a highly configured editor that can be set up to debug embedded software. The wide range of options can make it more challenging to set up at first, but the flexibility can provide developers with more tools and customizations than most vendor IDEs. Using the right extensions can make setting up VS Code easy. You saw the configurations for ST-Link and J-Link. Minor modifications to these configurations for your own targets will have you up and running debugging in VS Code quickly.
About the Author(s)
You May Also Like


