Where Does FFT Process Gain Come From?
December 7, 2011

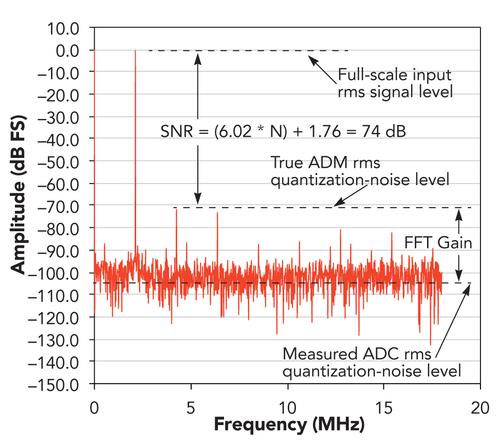
Specifications for analog-to-digital converters (ADCs) often include a fast Fourier transform (FFT) plot, such as the one shown in the figure, for a 12-bit ADC with a single-frequency input signal. In this case, a 12-bit Maxim MAX1420 ADC with a 60.049MHz sampling frequency (fs) sampled a 2.126MHz input tone with an amplitude of -0.5dB (full scale). The FFT plot shows harmonics at 4.252MHz and 6.377MHz due to device nonlinearities, and the FFT indicates a noise floor at about -104dB.
An ideal N-bit ADC has a theoretical signal-to-noise ratio (SNR) of (6.02*N)+1.76dB, or roughly 74dB for a 12-bit converter when driven by a full-scale sine wave. Here the term "noise" refers to ADC quantization noise. But when plotting the FFT results for the test described above, this theoretical value appears worse than the measured noise floor. This difference, called FFT processing gain, arises from the nature of the FFT, and you must keep it in mind when you examine such plots to evaluate ADC performance. You can estimate the FFT processing gain using the formula:
FFT gain = 10*log(M/2)
M equals the number of points processed in the FFT. In the earlier example for M=4096 points, the FFT processing gain amounts to 33dB. But what causes this gain?
By its nature, an FFT frequency bin has an amplitude response of sin(x)/x, so the value in each bin arises mainly from its main amplitude lobe. According to the signal processing practitioner Richard G. Lyons, we may think of the value of the mth FFT bin as the output from a narrow bandpass filter with a center frequency at mfs/M. Increasing the number of ADC samples used in an FFT decreases bin bandwidth and increases bin amplitude. A larger number of samples also improves frequency resolution and decreases the amount of noise in the bin's passband. Doubling the number of samples, for example, decreases noise power in a bin by 3dB. Thus, when you process a signal with an FFT, you can dig out signals from background spectral noise.
Lyons writes in his book Understanding Digital Signal Processing: "The discrete Fourier transform's [DFT] output SNR increases as M gets larger because a DFT bin's output noise standard deviation (rms) value is proportional to √M, and the DFT's output magnitude for the bin containing the signal tone is proportional to M."
When you analyze information for the performance of an ADC and refer to an FFT plot, remember that the FFT noise floor will not represent the SNR for the ADC. For that information, you use the calculations shown earlier and account for the FFT processing gain.
For More Information:
Richard Lyons, Understanding Digital Signal Processing. Hoboken, N.J.: Prentice Hall, 2010. pp. 102-105.
Walt Kester, Mixed-Signal and DSP Design Techniques. Burlington, Mass.: Newnes, 2003. Section 5, page 5.20.
About the Author(s)
You May Also Like


