November 12, 2013

Figure 1. PSR+ vs. frequency measurement
David Karpaty and Sandro Herrera, Analog Devices Inc.
Evaluating the error frequency responses of a fully differential amplifier can be difficult and time consuming if standard measurement techniques are used. This is because the task requires measuring small differential and common-mode error signals. For example, evaluating the amplifier's power supply rejection (PSR) and common-mode rejection (CMR) over frequency requires measuring differential error voltages, while evaluating the amplifier's output balance over frequency requires measuring common-mode error voltages. At low frequencies, these error voltages can be in the order of microvolts.
Traditional methods of measuring the different frequency responses of a fully differential amplifier require either expensive lab equipment (like a differential network analyzer) or specialty interface circuitry to cope with the amplifier's differential output. The complex algebra method uses superposition to reconstruct the amplifier's differential and common-mode output voltages from single-ended output voltage measurements. Since the measurements are single-ended, a single-ended network analyzer can be used without an interface circuit. To perform these measurements, a vector analyzer is preferred since it can output the measured waveforms in complex number form, a data representation that can be easily manipulated during the reconstruction process.
Measurement steps:
Connect the analyzer's output port to the amplifier's input port(s) to provide a stimulus.
Calibrate the measurement path to compensate for losses in the cables and traces.
Connect the analyzer's input port to the amplifier's positive output port.
Measure the frequency response at the amplifier's positive output, making sure to set the analyzer to output a complex number data stream.
VOUTp = Rep + jxImp
Connect the analyzer's input port to the amplifier's negative output port. Do not change the analyzer's settings.
Measure the frequency response at the amplifier's negative output. VOUTn = Ren + jxImn
Compute the differential and common-mode frequency response using:
VOUT,DIFF = (Rep-Ren) + jx(Imp-Imn) = ReDIFF + jxImDIFF
VOUT,CM = (Rep/2+Ren/2) + jx(Imp/2+Imn/2) = ReCM + jxImCM
Compute the magnitude and phase of the differential and common-mode frequency response:
Mag(VOUT,DIFF) = 20log(√(ReDIFF2+ImDIFF2))
Mag(VOUT,CM) = 20log(√(ReCM2+ImCM2))
Pha(VOUT,DIFF) = atan(ImDIFF / ReDIFF)
Pha(VOUT,CM) = atan(ImCM / ReCM)
Measurement Example 1
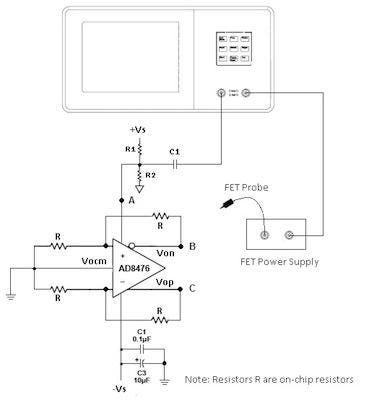
In our example, we'll measure the PSR+ of an amplifier, the AD8476, using a Rohde & Schwartz network analyzer. Characterizing an amplifier's PSR+ over frequency is challenging because the input excitation must be injected to the amplifier's power bus. If the amplifier is fully differential, the challenge becomes even greater because you must measure the output voltage's differential-mode component while rejecting the common-mode component. Luckily, the measurement can be simplified using the complex algebra method.
To measure positive PSRR, the first step is to calibrate the dc level-shifted sinusoid applied to the amplifier’s positive supply pin as shown in Figure 3. R1, R2, and C1 form a passive network that couples the network analyzer’s output port signal to the amplifier’s positive power rail while providing the necessary DC level shift (equal to +Vs). To match impedances to 50Ω, set R1 to 50Ω and R2 to a large value (approximately 100kΩ). C1 should be a non-polarized capacitor that is large enough to maintain the measurement’s low frequency corner below any frequency of interest.
After calibrating the source, measure the amplifier’s frequency response at its positive output. Make sure the analyzer is set to output real and imaginary results. After the measurement is done, store the results as a complex stream and measure the amplifier’s frequency response at its negative output. Store the new results as a complex stream.
Power supply rejection is calculated by subtracting the measured complex frequency response of the negative output from the measured complex frequency response of the positive output. This difference is equivalent to a differential measurement. As a last step, compute the magnitude of the resulting stream of complex numbers to obtain the amplifier’s PSRR in dB.
Using Excel to Organize the Measured Data
As shown in the example, the complex algebra method requires the combination of more than one measured data stream to calculate the desired result. Microsoft Excel provides an easy way to do the calculations. Assume that the measured data streams have been imported into Excel and arranged as follows: Frequency data in column A, the Real and Imaginary data from the positive output (Vop) in columns B and C respectively, and the Real and Imaginary data from the negative output (Von) in columns D and E respectively. With arrangement of the data, the results are calculated as follows:
Combine real and imaginary parts for Vop and place in column F. Formula: =COMPLEX(B1,C1)
Combine real and imaginary parts for Von and place in column G. Formula: =COMPLEX(D1,E1)
Calculate the difference (Vop – Von) and place in column H. Formula: =IMSUB(F1,G1)
Separate the real and imaginary components and place them in columns I and J respectively. Formulas: =IMREAL(H1), =IMAGINARY (H1)
Calculate the magnitude from the data column K. Formula: = 20*LOG(SQRT(I1^2+J1^2))
Figure 3 shows the magnitude of the PSRR measurement after processing the data in Excel using the steps described above.
Conclusion
The complex algebra method allows the measurement of the frequency responses of a differential amplifier without the gain-bandwidth limitations encountered when using an interface amplifier to gain up the measured signal and perform the differential to single ended conversions. By performing a series of single ended measurements, the DUT can be interfaced to the network analyzer to collect the data and overcome and the desired results can be obtained by post-processing the measurement��’s data in any commercial data analysis software like Excel or MatLab. This makes the characterization of a differential amplifier a much easier task.
References
1. Agilent E5070/E5071, ENA Series RF Network Analyzers, Application Note 1463, Characterizing Differential Amplifiers with True Differential Signals, Agilent Technologies Inc, May 21, 2003.
You May Also Like


