Amazon’s data crunchers say they’ve quantified what separates the best quarterbacks from the merely great ones.

“That’s why they play the game.” That’s the adage that explained unexpected outcomes in sports. Fans say they like the upsets that prompt such observations.
Indeed, the Cincinnati Bengals pulled off such an upset victory to beat the Kansas City Chiefs in the AFC Championship Game to advance to the Super Bowl. But in fact, fans crave the ability to know what will happen before the game is played.
This is why Amazon Web Services (AWS) Next Gen Stats has developed the passing score to define the performance of football’s key players. “The NFL teamed up with the AWS Proserve data science group to develop a more comprehensive metric for evaluating passing performance,” explained Rolando Ober of AWS in a LinkedIn post. “Built off of seven different AWS-powered machine learning models, the NGS Passing Score seeks to assess a quarterback's execution on every pass attempt and transform that evaluation into a digestible score.” This is what fans want to help them foresee the outcome of matchups such as the Super Bowl.
The seven models are completion probability, expected yards after catch, expected points, win probability, interception probability, predicted yards, and predicted expected points added. Each of the seven models employed breaks down a specific component of each play in an effort to neutralize the effects of things like a wide receiver making an acrobatic catch of a poorly thrown ball or a defending tipping a perfect pass into an interception.
Rather than looking at simple metrics such as passing yards, touchdowns, and interceptions, the Passing Score seeks to isolate the contribution of the passer from that of the receiver. It considers the level of difficulty of each pass, the probably yards gained by a targeted receiver and the likelihood of an interception on the play.
Of course, it is also crucial how each of these factors is weighted in producing the final score. The NFL outlines the Passing Score factors’ weights:

Expected Points Added Over Expected (EPAOE) accounts for 46 percent of the passing score. EPAOE measures production relative to an expected value (using our new expected yards model) and is calculated as the difference between the actual value of a pass and the predicted value of the pass before the ball is thrown when accounting for the probability of each pass outcome (e.g., completion, incompletion or interception).
Expected Points Added (EPA) accounts for 18 percent of the passing score. Instead of quantifying the success of a play in terms of yards gained, EPA represents success in terms of points added relative to the current play.
Completion Percentage Over Expected (CPOE) accounts for 11 percent of the passing score. CPOE is a derivative of completion probability, which measures the success of a pass relative to the difficulty of the throw. The CPOE feature used in the score does adjust for dropped passes.
Interception Probability (INT Probability) accounts for 11 percent of the passing score. INT Probability measures the likelihood that a pass will be intercepted if thrown.
Air Expected Points Added (Air EPA) accounts for 7 percent of the passing score. Air EPA is equal to the value of a completion plus the yards a receiver would be expected to gain after the catch. Air EPA is a proxy for the optimal reward of a pass within the control of the quarterback.
Expected Air EPA (xAir EPA) accounts for 7 percent of the passing score. xAir EPA is equal to the value of a completion (plus expected YAC), relative to the likelihood of a completion (e.g., completion probability).
Win Probability (WP) is not a feature in the model, but it is used as an aggregation play-weight. On any given play, the offense's pre-snap win probability for is used as a weight in the passing score formula, where closer to 50 percent win probability equals one and closer to 10 percent or 90 percent equals 0.6.
For stats nerds, the NFL explains on its blog how it breaks down all of this information. “Each component is converted to a standardized z-score based on the population of all pass attempts from the 2018 through 2021 seasons (n = 70,439). To reduce the impact any one component has on dominating the score, each individual z-score was selectively clipped at 3 or 4 standard deviations below and above the mean. The linear combination of components makes up an individual play score that ranges from 50 to 100.”
Further, the analysts weigh the rating according to the importance of the situation when the data was collected, helping to filter out garbage-time play when a game’s outcome was already decided. This gives greater weight to plays that occurred in close games and giving about 60 percent less value to plays when the game’s outcome was estimated to 90 percent decided or more compared to games that were still even odds.

The league says that it has found that quarterbacks who have a score of 85 or higher are ones that the team is winning with, rather than winning in spite of, and that scores of 90 or higher indicate a team that is winning because of the quarterback’s play. Quarterbacks with a score of 80 or lower are characterized as “young players acclimating to the league or replacement-level talent that teams will look to upgrade from next season.”
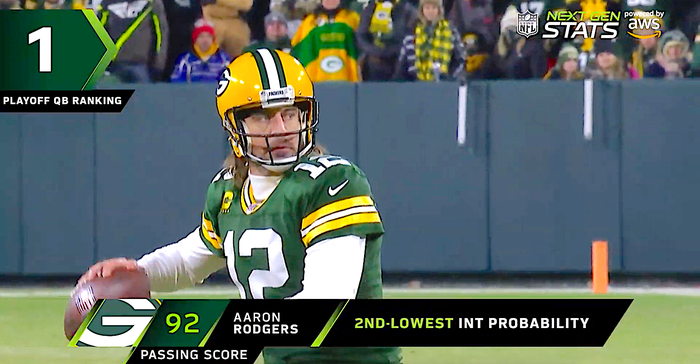
The top passer for 2021, according to this system, was the Green Bay Packers’ Aaron Rogers, with a score of 92. Amazon says that using the Passing Score as a foundation, now it can expand to consider related aspects, such as rushing, sacks, and pressures in the future.
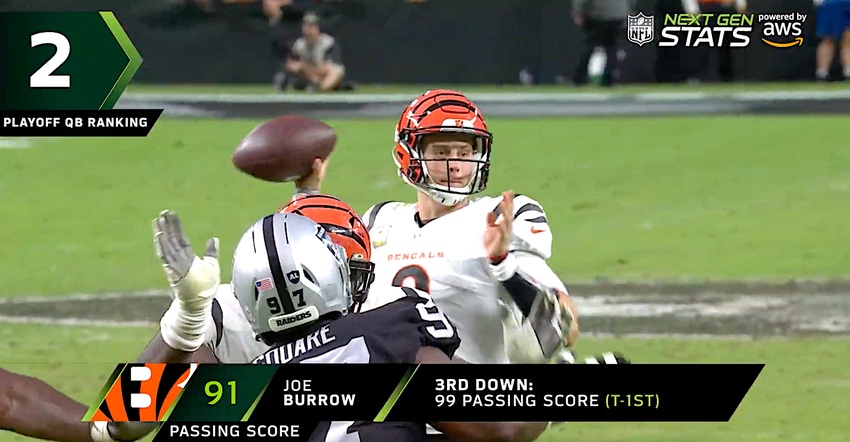
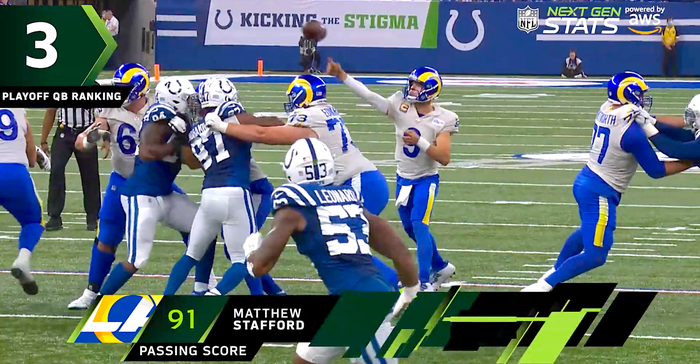
After all that, we should have a clear idea which quarterback has the upper hand in the Super Bowl, right? Maybe not. After sifting through mountains of data, AWS Next Gen Stats assigned the Bengals’ Joe Burrow and the Rams’ Matt Stafford rank right behind Rogers, with identical ratings of 91, leaving us to wait and see how each of them actually performs on Super Bowl Sunday. That’s why they play the game.
About the Author(s)
You May Also Like


