Excess self-discharge indicates potentially catastrophic problems within the cell. Know which external factors impact the results.
February 1, 2021
Ed Brorein, Keysight Technologies Automotive and Energy Solutions
Lithium-ion cells gradually discharge even when they are not connected to anything. Some self-discharge is normal. However, excess self-discharge indicates potentially catastrophic problems within the cell, such as micro-shorts caused by conductive particles or dendrite growth, introducing leakage paths within the cell. Due to this, all cells are screened in manufacturing for self-discharge.
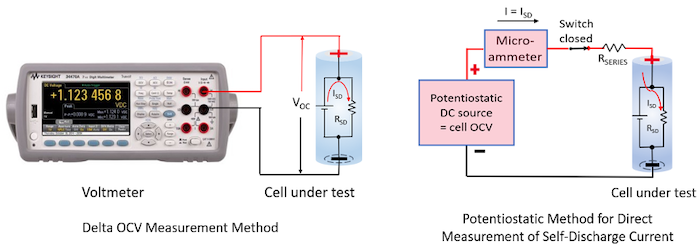
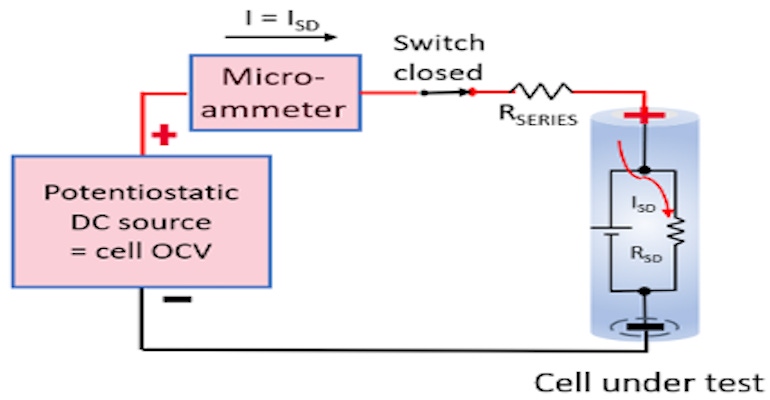
There are two main methods for testing self-discharge; the delta open-circuit voltage (OCV) measurement method and the potentiostatic method for measuring self-discharge current. These are illustrated in Figure 1.
|
Figure 1: Self-discharge measurement methods. (Image Source: Ed Brorein, Keysight) |
Very briefly, for the delta OCV method, the Li-ion cell’s drop in OCV is measured over an extended period, typically weeks. A drop in OCV is an indirect indicator of loss of charge. This is the more traditional method used for measuring self-discharge.
In comparison, the potentiostatic method directly measures a cell’s internal self-discharge current is typically on the order of an hour. This is accomplished by holding the cell at a constant potential with a very stable external voltage source. At equilibrium, the current being supplied by the external source equals the cell’s internal self-discharge current, as the cell is being held at a constant state of charge (SoC) by the stable external voltage source.
A top priority for testing cells for self-discharge is getting consistent and valid results. This may seem straightforward in principle. However, in practice, most find it very difficult to get consistent and valid results with good correlation across multiple lots and test runs. The underlying challenge is that self-discharge is far from being relatively fixed and constant. Unless testing is very carefully controlled, the results will not be consistent, valid, or correlate well. This is true for either of the two methods for measuring self-discharge on lithium-ion cells, as well as trying to establish a correlation between the two different methods. Top factors affecting self-discharge measurement are illustrated in Figure 2. Note that some factors impact just the cells, just the measurement methodology, or both.
|
Figure 2: External factors impacting cell self-discharge measurements |
It is worth noting even small changes in some of these external factors can cause a large change in the results. To quantify the impact of these external factors, a group of sixteen 2.4-Ah lithium-ion NMC 18650 cylindrical cells were tested using both measurement methodologies while under the impact of these external factors. Let’s look at the impact of these factors in greater detail.
The Cell’s % State of Charge (% SoC)
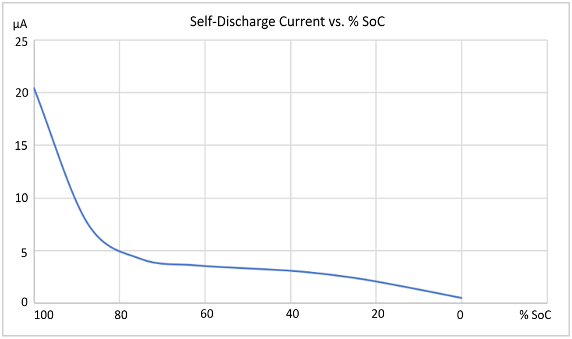
The % State of Charge (SoC) has a large impact on the cell’s self-discharge, as shown by the blue line in the graph in Figure 3, for the cells that were evaluated in this investigation.
|
Figure 3: Li-ion cell self-discharge versus % SoC. |
It was found that the self-discharge gradually fell off towards zero as the % SoC went to zero. Conversely, at the other end, it was found the self-discharge increased much more rapidly over 80% SoC. It is worth noting internal pressure can possibly become a factor at high SoC, due to electrode swelling.
As can be seen, the % SoC has a very large impact on self-discharge. Regardless of the actual %SoC level used, it is imperative that testing is always conducted at the same SoC level every time, to achieve consistent and valid results.
The Cell’s Temperature
Temperature likewise impacts the cell’s self-discharge. One can expect the self-discharge to typically double for every 10 oC rise. Thus, a 2 degree C change produces about 15% change in the cell’s self-discharge. A 2 degree C change is about what one may see in a temperature-regulated building over the course of the day or over many days.
Increased physical pressure on the surface of cell induced by temperature changes, can become a secondary factor, contributing to additional self-discharge. This is a more-likely consideration for a pouch cell battery pack design where uneven thermal expansion of different materials may put pressure on the cell stack.
Temperature and Equipment Accuracy on the Delta OCV Measurement Method
Temperature and equipment accuracy have a large impact on the delta OCV method measurement. As shown in the graph in Figure 4 for the cells tested here. 10 days was needed to get enough OCV drop for achieving reasonably valid results. After 10 days there was 1 mV or less drop for the good cells and 2mV or more for the bad cells in the group of sixteen cells.
|
Figure 4: 10-day room temperature delta OCV measurement method results. |
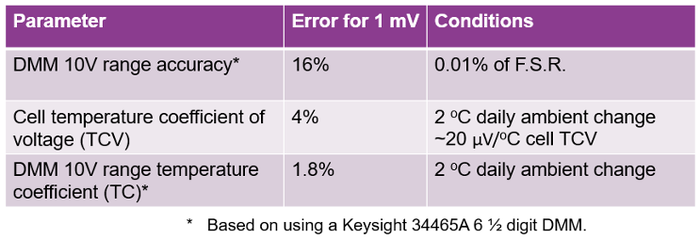
Based on the results in Figure 4, the dominant errors were analyzed and are summarized in Table 1.
The DMM 10V measurement range accuracy yielded 16% error for 1mV. The difficulty is measuring a very small voltage drop on top of the large offset of the cell’s OCV, requiring having to use the 10-volt range.
This is followed by the cell’s temperature coefficient of voltage (TCV) yielding 4% of error.
Finally, the DMM 10-volt range temperature coefficient yielded 1.8% error.
|
Table 1: Impact of temperature and equipment accuracy on the Delta OCV measurement in Figure 4. |
Temperature and Equipment Accuracy on the Potentiostatic Measurement Method
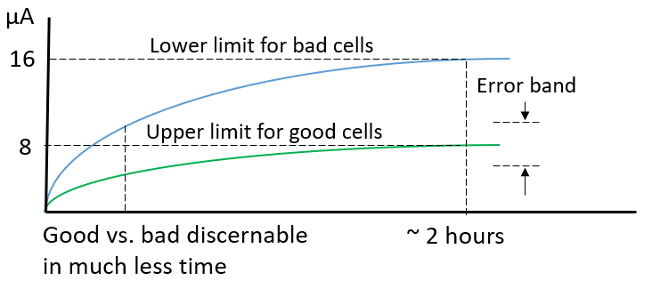
Temperature and equipment accuracy likewise have a large impact on the potentiostatic measurement method. The potentiostatic test results for the group of sixteen cells are shown in Figure 5. After 2 hours the measurements leveled off. The good cells had 8 µA or less of self-discharge, while the cells with high discharge had 16 µA or more of self-discharge.
|
Figure 5: Potentiostatic measurement method results. |
Based on the results in Figure 5, the dominant errors were analyzed and are summarized in Table 2.
The dominant error is due to the cell’s temperature coefficient of voltage (TCV). This contributes 18% error with 0.07 OC temperature change over the 2 hour potentiostatic test time. It is worth noting that the error here would be consistent independent of the cell’s size.
The equipment ammeter accuracy was the second error factor, contributing 3.4% error. It is worth noting that these are very small cells. Self-discharge scales directly with the cell’s size. So, this error would then scale inversely, being proportionally smaller for proportionally larger cells.
|
Table 2: Impact of temperature and equipment accuracy on the potentiostatic measurement in Figure 5. |
Charging and Subsequent Rest Time on the Delta OCV Method Measurement
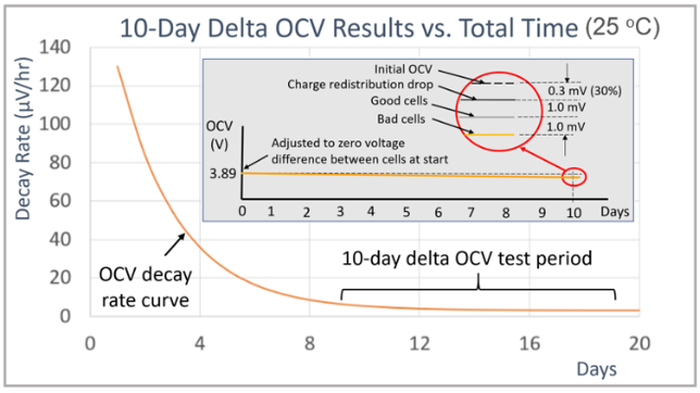
Charging impacts the cell’s charge equilibrium which subsequently impacts the cell’s OCV decay rate characteristic, causing it to exponentially decay over time. This is shown by the orange line on the main graph in Figure 6.
|
Figure 6: Impact of charging and rest time on delta OCV method measurements. |
Charging causes the cell’s charge to have a gradient that needs to redistribute itself over time in order to return to an equilibrium state again. The initial peak OCV decay rate depends on how heavily the cells were charged before the start of OCV measurements. The impact of charge redistribution is that it adds offset to the self-discharge measurement until the cells are fully rested and at equilibrium again. When at equilibrium then the OCV decay rate becomes constant, due only to the cell’s self-discharge. To illustrate, a 10-day delta OCV measurement, started after 9 days of rest, is that it adds an offset of 0.3mV, or 30% to the measurement. This is shown by the expanded view in the circle of the inserted image in the graph in Figure 6. This highlights the need for having enough rest time after charging so that the charge redistribution effect does not overwhelm the desired self-discharge measurement. Note also, that the underlying self-discharge is unaffected. It is only the measurement method that is being impacted. The OCV drop due to self-discharge alone is still under 1 mV for the good cells and over 2 mV for the bad cells, just as for when the cells are tested when fully rested and at charge equilibrium.
Charging and Subsequent Rest Time on the Potentiostatic Method Measurement
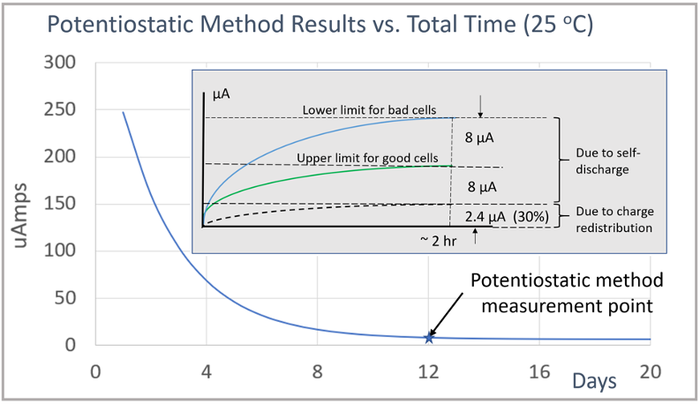
The potentiostatic method for self-discharge measurements, like the delta OCV method, is similarly impacted by charging and subsequent rest time. The potentiostatic current measurement exponentially decays following charging, as shown by the blue line in the main graph in Figure 7.
The initial peak decay rate depends on how heavily the cells were charged before the start of current measurements. In addition, it also depends on the series resistance setting in the potentiostatic method measurement setup, with a lower value increasing the initial peak current measurement value. The impact of charge redistribution is that it adds offset to the self-discharge measurement until the cells are fully rested and at equilibrium again. Then when at equilibrium then the current measurement becomes constant, due only to the cell’s self-discharge.
To illustrate, for a 2-hour potentiostatic method measurement, started after 12 days of rest, the charge redistribution effect adds an offset of 2.4 µA or 30% to the measurement. This is shown by the inserted image in the graph in Figure 7. This highlights the need for having enough rest time after charging so that the charge redistribution effect does not overwhelm the desired self-discharge measurement. Note also, that the underlying self-discharge is unaffected. It is only the measurement method that is being impacted. The current measurement due to self-discharge alone is still under 8 µA for the good cells and over 16 µA for the bad cells, just as for when the cells are tested when fully rested and at charge equilibrium.
|
Figure 7: Impact of charging and rest time on delta OCV method measurements. |
Impact of High-Temperature Aging on Rest Time After Charging
It is highly undesirable to have to wait for cells to rest for 9 to 12 days before being able to start any self-discharge measurements after any charging on the cells, as has just been described. This is the situation following the formation process in cell manufacturing, as the cells come out of formation having just been charged. High-temperature aging is routine practice following the formation process, as this greatly accelerates charge redistribution settling, greatly reducing the rest time. To illustrate, going from room temperature to 40 degrees C aging provides the range of a 3-fold acceleration in charge redistribution. The subsequent aging time is now in the range of 3 to 4 days, compared to the room temperature aging of 9 to 12 days.
Formation Process Flow using Delta OCV Method versus Potentiostatic Method
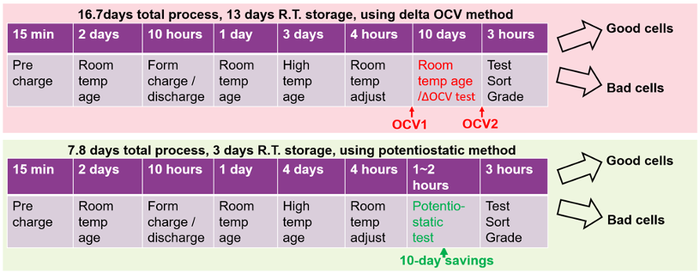
The formation process flow comparing using the delta OCV method versus the potentiostatic method for measuring self-discharge is illustrated in Figure 8. The process for the two different measurement methods is nearly identical up to the point where the cells’ self-discharge is measured following high-temperature aging. After that point, the delta OCV method adds 10-days of room temperature storage to the process versus 1 to 2 hours or less for the potentiostatic method for self-discharge measurement. Here, using the potentiostatic method provides a 53% reduction of total process time and a 77% reduction of room temperature storage, representing a significant opportunity for a cost savings in the formation process.
|
Figure 8: Formation process flow comparing the two self-discharge measurement methods. |
Summary: Good Practices Consistently Achieve Valid Self-Discharge Measurement Results
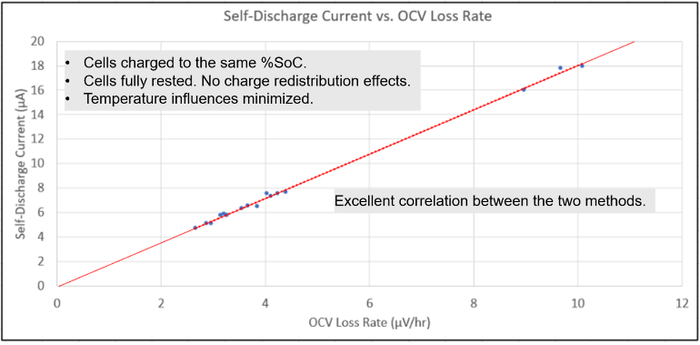
By carefully controlling the external factors outlined, one can consistently achieve valid self-discharge measurement results. This is true regardless of using either the delta OCV method or the potentiostatic method for making self-discharge measurements. To illustrate this, both methods for self-discharge measurements were performed on the 16 cells used in this investigation. The results are plotted in the graph in Figure 9.
|
Figure 9: Correlating delta OCV method and potentiostatic method measurement results. |
The potentiostatic method measuring the self-discharge current is plotted on the vertical axis while the corresponding value using the delta OCV method measuring the rate of OCV loss for each cell is plotted on the horizontal axis. What was found is that, when a linear line was placed on all the points, they lined up with the line projecting back through the origin, demonstrating an excellent correlation between the two measurement methods. Several external factors were carefully controlled between the two methods to achieve excellent correlation, including:
Cells were charged to the same % SoC.
Cells were fully rested to eliminate any charge redistribution effects.
Temperature influences were minimized.
To close, self-discharge measurements are greatly impacted by several external factors as discussed here. However, by exercising good test practices it is possible to consistently achieve valid self-discharge measurement results over time.
Ed started at Hewlett Packard in 1979. During his 41 years with HP, Agilent, and now Keysight, Ed has been an engineer in R&D, manufacturing, and finally marketing in a variety of roles, now helping R&D and manufacturing customers with the application of DC power products and test systems for testing a variety of electronic devices. Presently Ed is responsible for gaining application insight in this industry and help customers with Keysight’s battery and cell testing solutions.
Ed holds a BSEE degree from Villanova University in PA, and an MSEE degree from the New Jersey Institute of Technology.
You May Also Like
