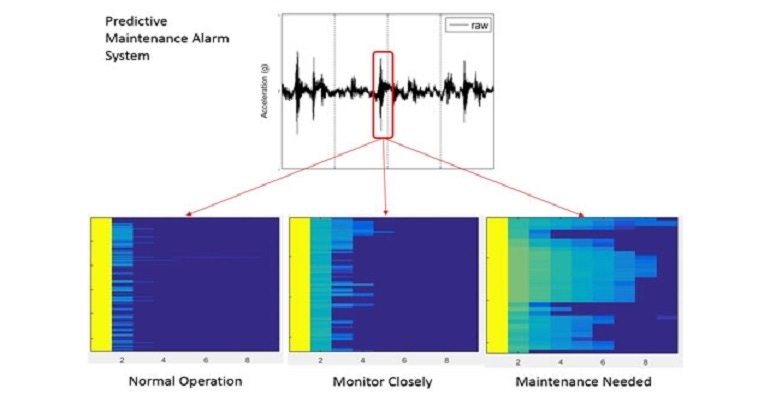
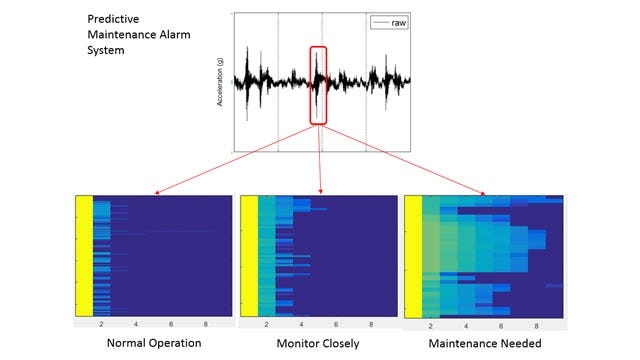
It’s one thing to collect data from operational equipment. It’s another thing to analyze that data and develop algorithms that predict when the equipment will begin to slow down or fail.
August 14, 2020

Big Data is giving manufacturers the ability to predict the remaining useful life of machinery. That simple effort can improve production, reduce work slowdowns, and avoid costly stoppage. The goal is the Goldilocks of perfectly timed maintenance. Not too soon, not too late. But how do engineers develop effective predictive maintenance? Achieving that goal can be accomplished by understanding the condition data and putting it through an algorithm that can identify when the equipment is likely on its way to failure.
The key step in the predictive maintenance algorithm development according to Mathworks – a company that produces condition-analysis tools – is to identify condition indicators. These indicators are “features” that reveal system degradation. Once those features are identified, engineers can analyze their workflow and extract features in operation data that distinctly define healthy operation as well as various fault types.
Accessing the Right Data
To begin the process, you have to collect the data. “Accessing data is the first step. For our customers in aerospace and energy, they collect the data and then remove the noise and outliers in the data. Then they distinguish between healthy and unhealthy data. Those are the features,” Aditya Baru, senior product manager at MathWorks, told Design News. “Once you have this set of features, you can use them with a predictive model and look at the data coming in. The features allow the engineer to see it as good or bad data.”
You can turn the collected performance data into a spectrum and analyze the spectrum. “An energy a customer extracted data that indicated healthy operation of a pump,” said Baru. “They took the pump data and discovered that a healthy system has a particular data spectrum. If the pump is unhealthy, it has another spectrum. You need your experience as an engineer to extract those spectrum features and understand the difference between health and unhealthy performance.”
Turning Data into Features
One of the challenges in making condition data useful is to break it down into actionable information. “Let’s take the example of Daimler. They have an assembly line with a lot of data, tons of machines and sensors running 24/7,” said Baru. “They’re collecting so much data that when they want to go back and analyze it, it’s difficult to see if there is deviant data. How do they look at so much data? They’re trying to find a needle in a haystack. What’s useful and what isn’t useful? Sensors have some direct data, some text data.”
The data has to be broken down into features that can help determine the difference between healthy and unhealthy machine performance. “To perform predictive successfully you have to find useful features,” said Baru. “The people who collect the data are not the people who analyze it, so they don’t always know what’s needed. If the data is automated, it’s much easier. They look at just the feature data. That can be reduced to 20% of the total data. They can look at failures easier and look at just the data that has meaning. It simplifies what the engineer has to do.”
What’s the Frequency, Kenneth?
In order to get a full look at the health of a machine, you have to identify what data appears when the machine is unhealthy. “The algorithm is effectively a box. In comes sensor data, and out of the box comes a warning or alarm. The engineer sets up an algorithm and the data indicate where there is a fault or an anomaly,” said Baru. “We worked with a manufacturer that desperately wanted to get failure data before stoppage. So, they broke a machine and developed an algorithm to predict what it will look like when the machine breaks. You extract data and create an algorithm of the machine not working. They extracted a bunch of features from the broken machine.”

The unhealthy data was necessary for this manufacturer to get a clear picture of the range of features from healthy to unhealthy. “Using the broken machine algorithm, you can see what features are more important than the others. You feed in live data and see what the answer is based on the algorithm,” said Baru. “What matters depends on the individual machine. We create a bucket of time-based frequency and model-based frequency and you can figure out which gives you the best indication of healthy and unhealthy machine performance.”
The variances in machine performance can be viewed as a spectrum, and those spectrums can become their own features that indicate various levels of healthy and unhealthy. “With any machine with rotation, you can look at the frequency-based data and see what’s happening,” said Baru. “When a frequency changes, it may indicate that the machine is slowing down. You can see that slowing determination and take action. You take the data and create a model and look at the qualities of the model. You take 100 samples, then you take the next 100 samples and see the features. You watch the model change over time and see the different features.”
Finding the Sweet Spot
So how do you tell when the data indicates action? You don’t want to stop production to replace a part if it looks like the part will last until the replacement has arrived. Likewise, you don’t want stoppage due to failure. “The sweet spot for analyzing the health of a machine is application-specific, company-specific, and person-specific. Do they want to replace a failing part immediately? Do they tend to be really conservative?” said Baru. “You don’t want something to blow or hurt somebody. You have to figure out what the sweet spot is for you. Look at the data range between healthy and failure. Most people don’t have failure data, so how do you expect to build an algorithm when we don’t know what failure looks like? But when you have good and bad data, you use feature extraction to figure it out what matters.”
Even if a manufacturer doesn’t trust all of the analyzed data, it is still useful to get an idea of whether the machine is performing well or not. “You use the feature to build predictive models and look at when you need to take action. People don’t yet trust the machine algorithm on all of the work, but it gives them a good idea of what to do next,” said Baru. “One customer has a classification model that tells them at which point they are likely to move into a fault. Fault-one isn’t as bad as fault-two or three. But if you are at fault-two or three, you have to stop now. The condition data tools can help give you better information to make those decisions.”
Rob Spiegel has covered automation and control for 19 years, 17 of them for Design News. Other topics he has covered include supply chain technology, alternative energy, and cybersecurity. For 10 years, he was the owner and publisher of the food magazine Chile Pepper.
About the Author(s)
You May Also Like


